Sunday, July 17, 2011

DLG


http://tahoe.usgs.gov/DLG.html

This is an example of a DLG. A DLG or Digital Line Graph is a digital representation of the features displayed on a U.S. Geological Survey topographic map.  DLGs contain a wide variety of information depicting geographic features. Example: hypsography, hydrography, boundaries, roads, utility lines, etc
The map above is a DLG of Lake Tahoe

Saturday, July 16, 2011

Statistical Map


http://mappery.com/map-of/United-States-Travel-Time-to-Work-Statistical-Map

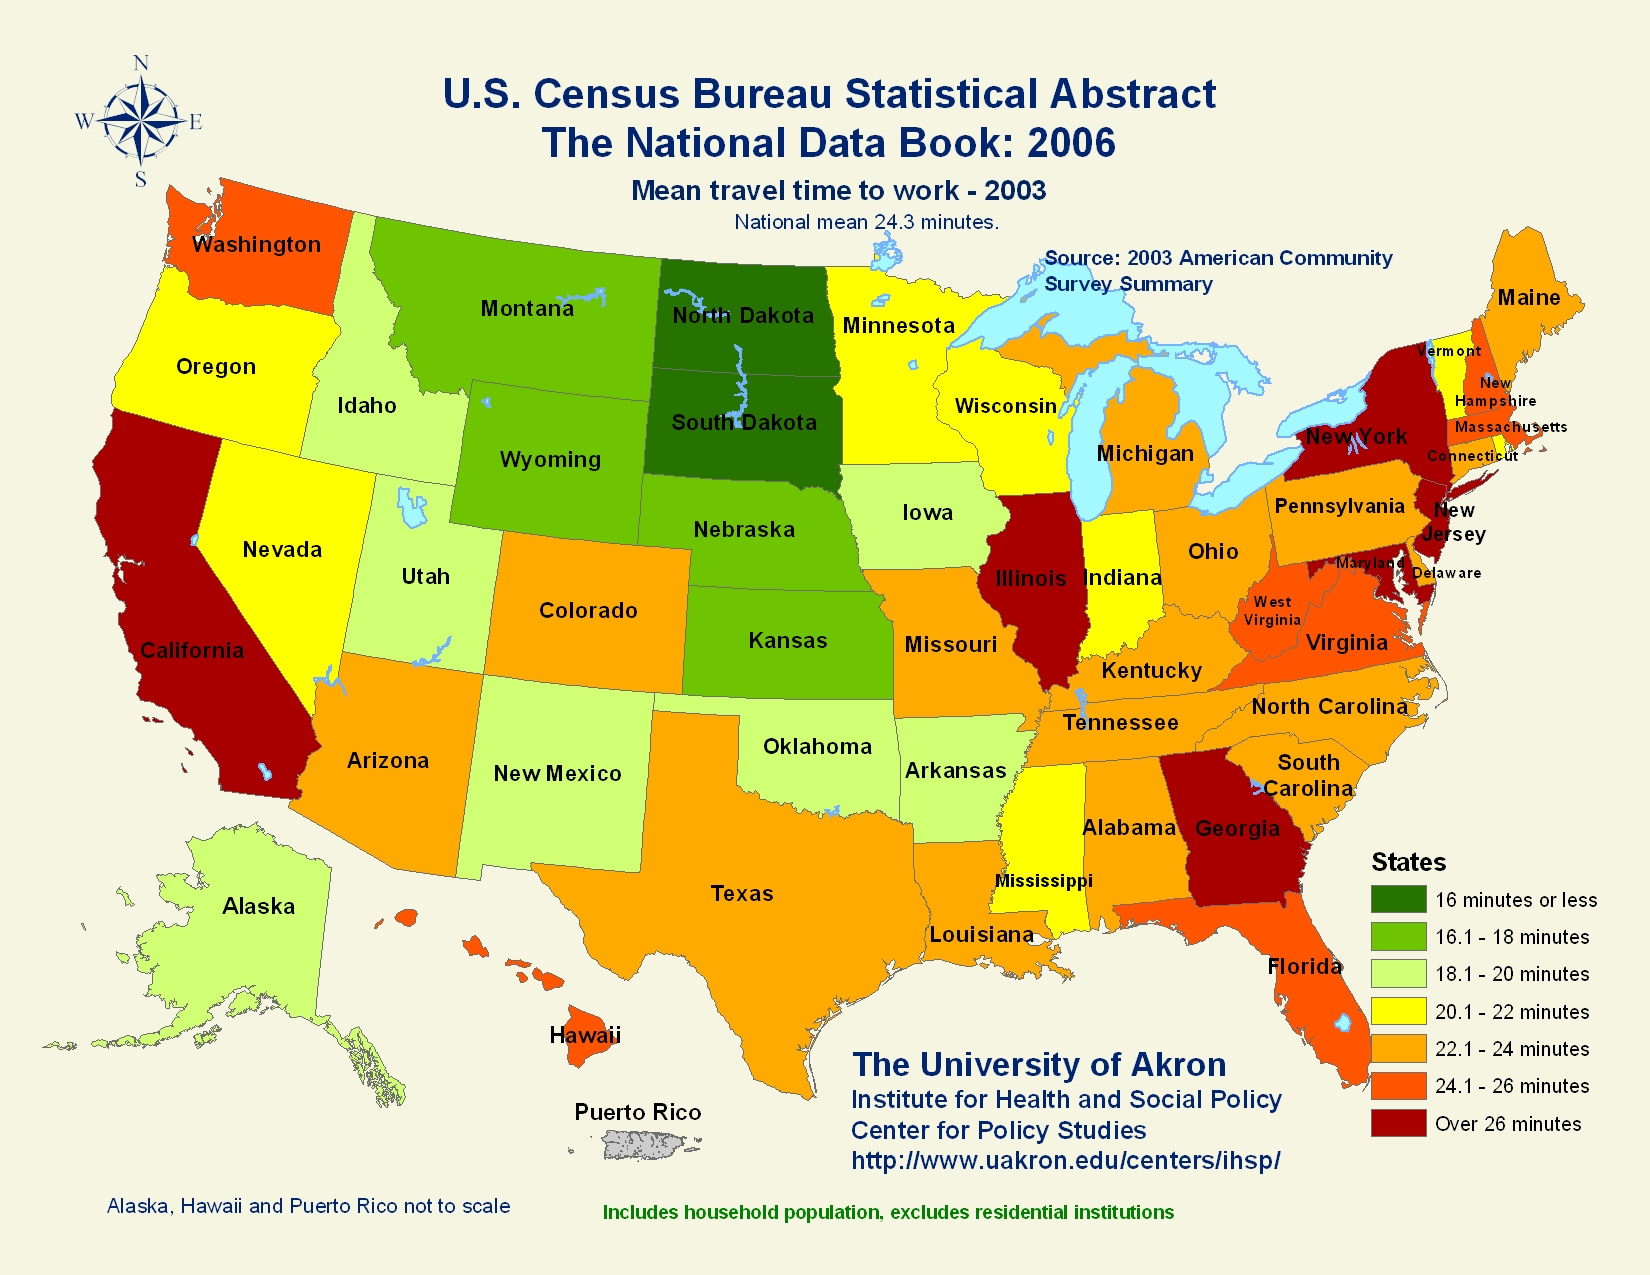
This is a statistical map of the average "travel time to work" per state. The average time for the country as a whole is 24.3 minutes. The key on the right is in equal intervals of 2 minutes which means that the map is not skewed in any way. It's just pure data.

PLSS map

http://www.fairview-industries.com/standardmodule/mn-exmpl.htm


The Public Land Survey System (PLSS) is a way of subdividing and describing land in the United States. The map above shows a town in Minnesota subdivided. Each one of the smaller sized squares is 1/16 of a section. The Bureau of Land Management designed this map so there would be an increase in the clarity of communication when dealing with cadastral matters, between cooperating organizations.

LIDAR Map

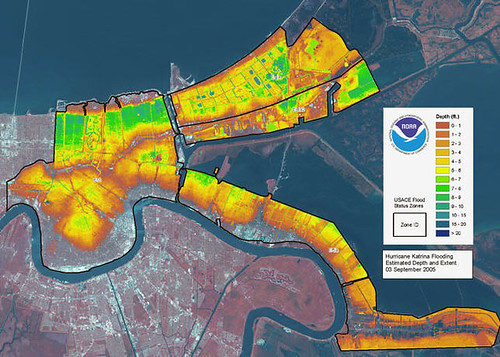
This is a LIDAR map of flood areas in New Orleans, LA after Hurricane Katrina. LIDAR is an optical remote sensing technology that can measure the distance to, or other properties of a target by illuminating the target with light.

Star Plot

http://www.itl.nist.gov/div898/handbook/eda/section3/starplot.htm

The plot above contains the star plots for 16 cars. The variable list for this star plot is as follows:
    1Price
    2Mileage (MPG)
    31978 Repair Record (1 = Worst, 5 = Best)
    41977 Repair Record (1 = Worst, 5 = Best)
    5Headroom
    6Rear Seat Room
    7Trunk Space
    8Weight
    9Length
We can use this information to compare cars to each other, or to find a specific trait we want for our car whether it's price or gas mileage.

Correlation Matrix

http://yin.che.wisc.edu/images.htm

A correlation matrix is very similar to a similarity matrix, except that a correlation matrix shows the correlation between all pairs of data sets. The picture above shows a correlation matrix that was calculated for a protein for phage T7 (dealing with genetics).

Similarity Matrix


http://cgi.mtc.sri.com/Cluster-Lab/
This is a Behavioral Clustering Similarity Matrix. A red pixel means the similarity are close to 1 or 1.  A blue pixel means there are small similarity to none